Saturday, July 24, 2010

Week 10- Homeland Security PROTECT Lab


This is a map of a 3mile buffer around the NORAD entrance and also an inset map zoomed in on a 500ft buffer on the Cheyenne Mountain Heliport with roads included.


This is a map of the Secured Ingress and Egress points entering the 500ft Cheyenne Mountain Heliport buffer. I had no issues or pitfalls with this lab at all other than a small problem displaying my light of sight in another deliverable. I ended up opening a new ArcMap and applying instructions from Amber by phone and everything came out ok. Reasoning behing why it wouldnt show up on the map that I had built my other deliverables on, I have no idea. OFF TO THE FINAL PROJECT!!!!

Sunday, July 18, 2010

Week 9- Homeland Security PREPARE


This is a screen shot of my layers in ARC for the Week 9 Homeland Security Lab.

Sunday, July 4, 2010

Week 8- Law Enforcement


These are my map submissions for the Week 8 Lab. This lab was a good refresher on some things and was fun for me to do. I had no pitfalls or problems. Instructions were clear and results came out fairly well in my opinion.

Tuesday, June 29, 2010

Week 7 Location Decisions: On Your Own

Daytona Bound

This is my Power Point Presentation of the Week 7 Lab Activity. This was pretty similar to last weeks lab, which made it alittle easier to go through. I had no big issues other than at first not having my Euclidean Distance not fit the county boundry. I had realized I had not set my extent and my mask in the Environments before I had started my map. After I did that Everything fit fine and I feel good about my presentation.

Monday, June 21, 2010

Week 6- Location Descisions


This is a map showing two different weighted overlays of different criteria based on the couples requirements. The map on the left showing equal distribution of the 4 criteria at a 25/25/25/25 ratio. I used the green to red color scheme to show the best areas that would suit the couple the best. I also highlighted three tracts that I thought would be best with a white color outlined in red. The map to the right shows the same information with different importance to each criteria at a 40/40/10/10 ratio. I used the same symbology for this map as well green being good and red being worst. I also highlighted the three best tracts the same way as I did in the first map.


This is a complex map that includes 4 seperate priority maps. One showing the distance from a desired hospital in Alachua County, another is the distance from a desired school, then next two include information of the percentage of people between the ages of 40-49 and the median home values in the county.


This is a basemap of Alachua County, FL. Showing roads, places, and public lands. This map took very little time to complete. Getting everything ready to go such as the environments and projection seemed to consume most of the time in this map.

Week 5 Impact Assessments


These are maps created by using the ESRI exercises in Week 5 Impact Assessments assignment. All of these exercises were pretty straightforward as always with the ESRI exercises. These maps include information about Student Occupancy in Pewter City, a buffer of the Impact of traffic in an area of Pewter City and also a a map of Economic Performance of Agriculture, Fishing, and Forestry.

Wednesday, June 9, 2010

Oil Spill Participation Post Part 2-

GIS is used in as a useful tool in many different disaster situations. One way to involve GIS is to predict what might happen in a possible disaster. Some disaster relief efforts are totally based on damage models predicted on a computer. It is also used to help government officials and other decision makers locate where they will establish their medical centers and other disaster relief stations, and could help the homeless and others find their ways to shelter and to hospitals. And finally another way it can be used is to assess damage caused by the storm and to record damage costs. Maps could possibly be made to show damage before and after the storm, and then follow up maps to show recovery efforts and status on roads and so on.


In the past week we have researched the Deepwater Horizon Oil Spill. GIS is also used in situations like this. It can be used to map daily photos of the spill and how much it has spread. And by the use of Google Earth it can help show people around the world exactly where it is at the time. Projected photos of the spill can also be made to predict where the oil is heading and be able to give certain areas warning about the presence of the oil on nearby beaches and bays. Using information by the NOAA, maps can be formed to show animals that could be in danger of the contamination such as anything from crab and shrimp that will affect the local fishing for seafood, to birds and reptiles that live near the coastal waters.

Oil Spill Participation Post

Deepwater Horizon Oil Extent

This is a animation showing the Deepwater Horizons Oil Spill extent over the past month. I had no other issues other than ArcMap freezing up on me and having to do it about three times, then I finally got smart and saved it so if it froze again I wouldnt have to do it ALL over again.

Monday, June 7, 2010

Week 4 Oil Spills


These are two maps consisting of information on Booming Operations in the particular Index location I have chosen in the state of Florida. They also contain information on possible impact the oil spill could have on land areas and the existing wildlife in the area. The provided maps also contain tables with detialed information about what types of species are included in the area such as reptiles, terestrial mammals and also birds. And another table is presented to show the length of the current Booming Operations in feet. I had no major downfalls in this lab. It took alittle time putting everything together and finding and matching the particular species in the file provided with the ID number in the attribute table because there were so many creatures in the different categories and the Ids weren't in numerical order. Other than that it was a fun lab and looking forward to the next topic!

Tuesday, June 1, 2010

Week 3- Hurricanes


These are the first 2 map deliverables of Week 3 Hurricane Topic. The first map is the hydrology and the elevation of Hancock,Harrison,and Jackson Counties in Mississippi. The second map is a map of different landcover types that where affected by the surge in the same counties as stated before. It also contains a bar graph showing the percentages of each landcover that was affected. I really had no pitfalls in any of the deliverable projects. I had one issue that consisted of getting the red exclamation points but after some poking around, I ended up re-doing the part which I could not repair data. Other than that, everything was straight forward and very easy to follow.

Wednesday, April 7, 2010

Week 11- Roads and Cities Exercise

This is a the Cities and Roads Labeling Exercise from ESRI.

Tuesday, April 6, 2010

Week 11- Recreation Annotation Map


This is a annotation labeling map of certain Recreational Areas in certain in Florida

Week 11- Reclassify Data to Common Scale Exercise

This is a map of the Vegetation in Harlan KY. I didn't really know what the description meant by saying using nescessary info to give the output meaning, so I figured I would give it all the essentials for a map and to let the legend tell the nesscessary info.

Week 11- Model Builder Exercise

This is a screen shot of the Model Builder in the Spatial Analysis Module

Week 11- 3D map

This is a screen shot from one of the exercises in the ESRI Modules. In particular, it is the final step in the Symbolize a 3D Raster Exercise.

Thursday, March 25, 2010

Week 10- Majority Parcel Owner Map

This is a map of Gulf County Florida's major parcel owners and the amount of acres they own. This was a really easy straight forward lab, kind of a relief not that the others have been really hard it was just nice to have a quick easy map that covered all the basics again. I'm think what I'm getting at is that it was a refresher lab. Not to much to write about I liked this lab and I'm looking forward to seeing what is involved in the final project in the next couple weeks.

Monday, March 22, 2010

Week 9- Vector Analysis 2


This is a map of Potential Camp Sites in a State Park. This lab wasn't to hard to complete. It involved making buffers and overlays in different layers. I didnt' have any big problems with this lab other than having a hard time exporting some things to a new layer but from some help from the discussion board, I worked through it.
Questions:
#1- I used the Intersect Tool, it showed very little to no difference at all between both tool results.
#2- I used the erase tool since it allowed me to erase any intersections made by the possible sites layer and the conservation areas layer.
#3- There are 79 campsites total, the largest area is 7,765,034 sq. mi, and smallest area is 748 sq.mi.

Saturday, February 27, 2010

Week 7- Data Editing Lab

This map is a map of the UWF campus. In this lab I created a shapefile, modified an existing shapefile, and also digitized another building and a road. This lab was fairly simple if you paid any attention the the ESRI module. No big issues with this exercise. I also learned a lot from the ESRI readings and exercises.

Sunday, February 21, 2010

Georeferencing Lab Map

This is a map of the UWF Campus. During this lab I used the georeferencing features to combine two different layers, one of which was the correct x,y coordinates and the other layer was a distorted aerial photo. This lab was pretty straight forward and I kind of enjoyed it. I didn't really incounter any issues at all and really thought it was kind of cool to be able to manipulate the map to make a layer match particular points of another layer.

Saturday, February 20, 2010

Data Search Lab Map # 3

This is a map of the Conservationsal Areas of Broward County,Fl. It includes the areas of invasive plants and all the conservation areas in the county. It took me a little while to find this data, and then when I did download the layers it was a bigger size than my normal county boundry that I had been using the other two maps. So I ended up downloading the county boundry from the same website that I got all the included info that I had so it would all end up being the same size. Also, when downloading the Invasive Plants layer with points it seemed to be really cluttered, so instead of using the points layer I chose to use the group layer and that seemed to releave some clutter and labeled the areas instead of the particular points. Other than that I had no crucial problems. This is my final map which concludes my Data Search Lab.

Data Search Lab # 2 Map

This is a map of three different raster datasets; DOQQ, DRG, DEM in three seperate quadrants for Broward County,Fl. At first I was kind of at a spot where I wasn't sure what I needed to download and after that how I needed to convert the items to make them work into ArcMap. After some help with some discussion board posts, not knowing what a perfect map in this lab was supposed to look like, I think I pretty much got the right idea about things and it turned out fairly well to my standards. I will have one more final map to complete this lab within the next couple hours.

Thursday, February 18, 2010

Data Search Lab Map #1


This map is projection of Broward County, Fl. It shows the some of the major cities and towns, interstates and major roads. At first, I was really nervous on what to do with this map, and after trying to feel it out and looking at the discussion boards I slowly came to the map that I have completed. It seemed fairly easy after I got the concept down. I had to change the projection layouts on a couple layers, really wasn't really sure if I could make it work but it came out in the wash. I have 2 other maps that I plan on submitting by the end of the weekend, including the other requirements of the lab.

Friday, February 12, 2010

Haiti Participation Post Map

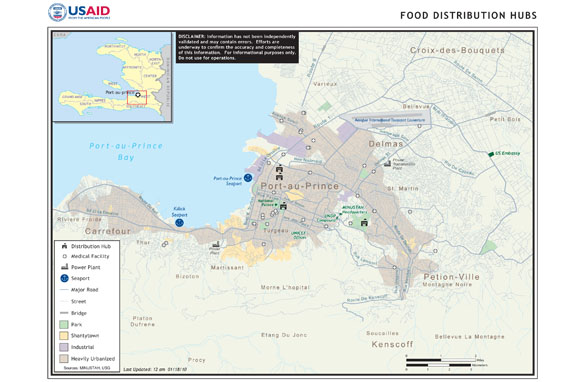
I thought this was an interesting map because it explains the food distribution hubs in Haiti. It also shows medical facilities, power plants, and seaports located in the Port-au-Prince area. I found this map off of a CNN website. The map has pretty much all the nesscessary map elements other than a North arrow. Overall I feel like its a decent map to get the basics on how many support and medical locations are actually in the zone where the quake hit and some other small details about the area.

Monday, February 8, 2010

Week 4- Map Projections Lab

This map is of three different projections of the state of Florida, and its comparisions of the size of a select number of counties given by each projection. This lab was pretty much clean cut and to the point, and fairly easy to keep up with. I was interested in how much difference there was in the size of the counties given by each of the projections. I also made a simple comparison table by using the Excel program and pasted it to the map document.

Saturday, January 30, 2010

Week 3 Map 3

This is a map of the Elevations of Mexico. Fairly simple to make, really prefer the streched map over the classified map.

Week 3 Map 2


This is a map of Central Mexico and its highways, rivers, railroads, and urban areas. Had no trouble with creating the map but like some others students I have noticed, I had spent alittle extra time trying to figure out the TOC and the legend contents on how to make things I wanted appear and how to change the names to what I wanted them to be. Other than that, this has been another good lab exercise.

Week 3 Map 1


This a map of the State Populations in Mexico. I had no real issues making this map. It's fun for me learning all these small things that aren't as hard as I thought they would be.

Saturday, January 23, 2010

Module 2 World Map Lab Assignment


This was a nice little Lab. I did not get hung up on anything really the directions were again pretty self explanitory. I'm pretty excited to what's next I've always enjoyed doing stuff like this.

Tuesday, January 12, 2010

Deliverable #2-Potential Youth Center Sites


I had no problems with exercise either. I had never went to the extent of combining layers, so this was my first time doing pretty much everything in this exercise.

Deliverable #1-Locating the San Diego Zoo


This exercise was pretty simple. Going by my previous experience navigating through the basic tools, it was more of a refresher for myself. I had no problems and the directions were pretty self- explanatory.

Tuesday, January 5, 2010

Ready To Start!

Tomorrow starts my first day of GIS Certification. I'm excited and a little nervous at the same time on feeling out how the whole online thing will go since I'm totally new to it. So I'll hope for the best try and get all I can out of the whole experience!